Institutes & Centers
Istituto per l'osservazione della Terra
Istituto per l'osservazione della Terra
- Deutsch
- English
- Italiano
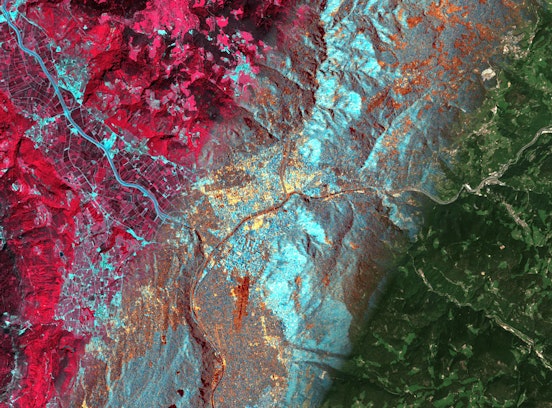
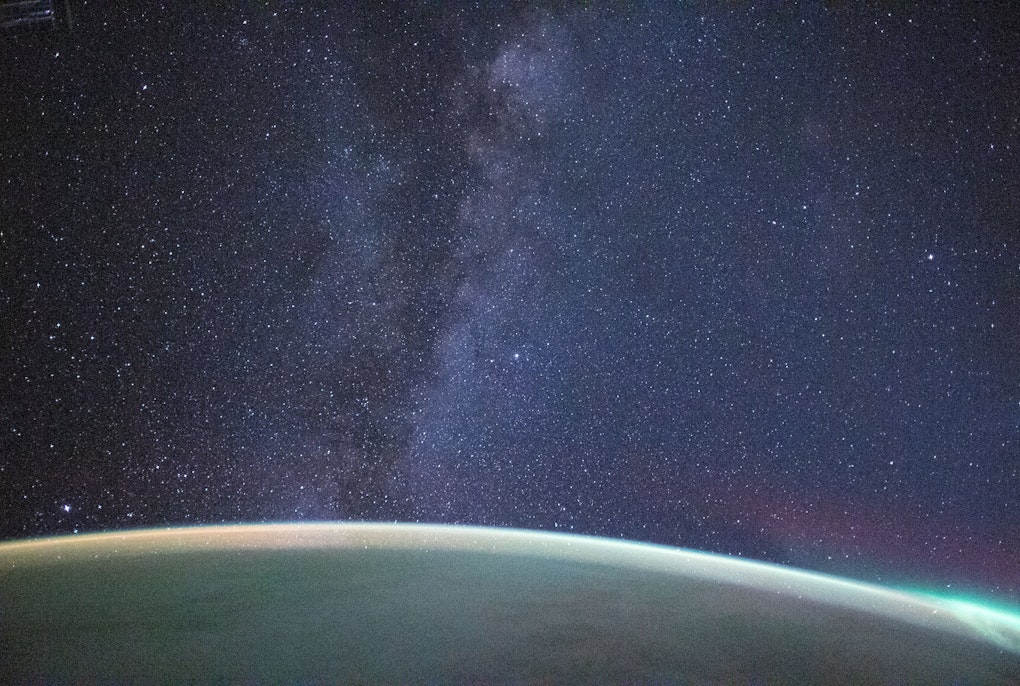
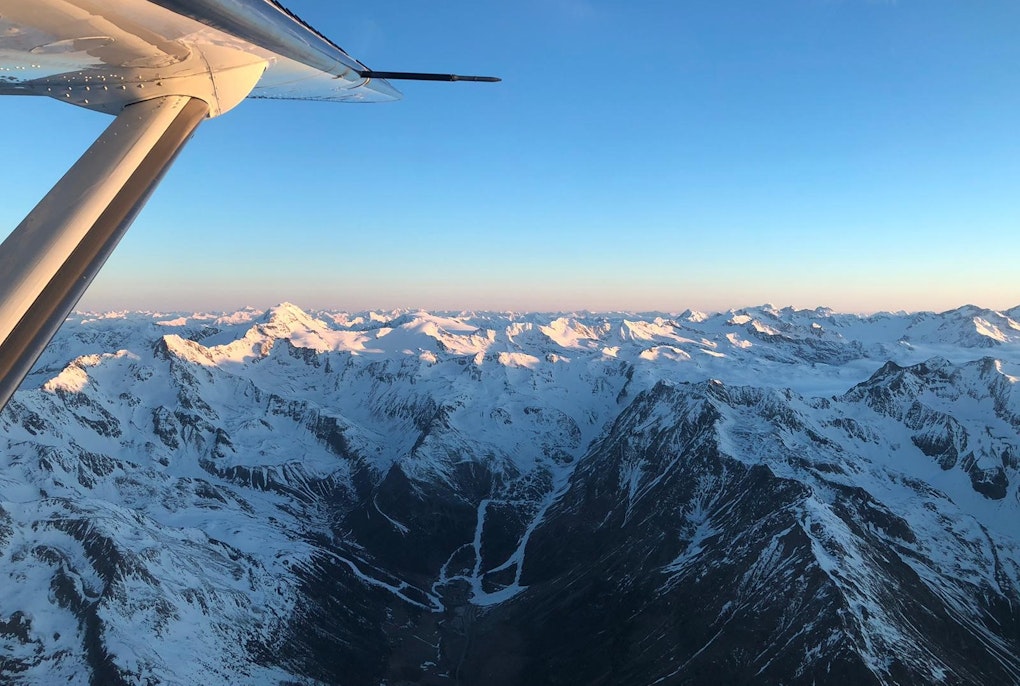
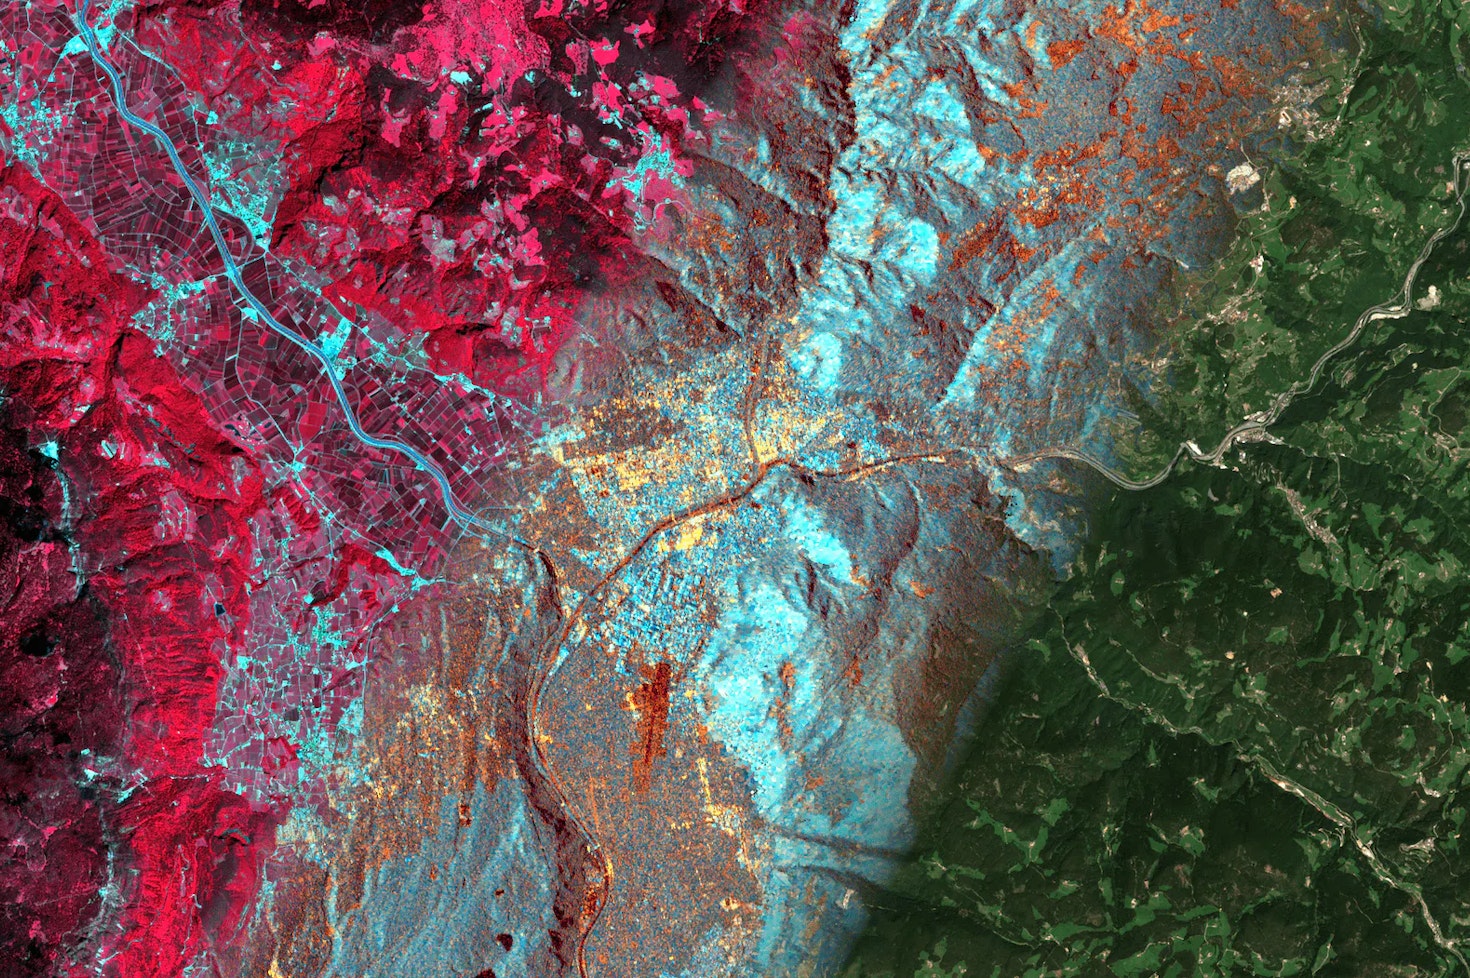
Negli ultimi decenni, la vulnerabilità delle regioni montane agli eventi estremi è a causa degli impatti generati da fenomeni come la riduzione dei ghiacciai, tempeste, ed annate siccitose, la cui frequenza ed intensità sono aumentati. Nell’Istituto per l’Osservazione della Terra, monitoriamo le dinamiche della superficie terrestre nelle regioni montane per comprenderne i cambiamenti, investigarne le cause e supportare le comunità locali.
1 - 4
Facts
& Figures
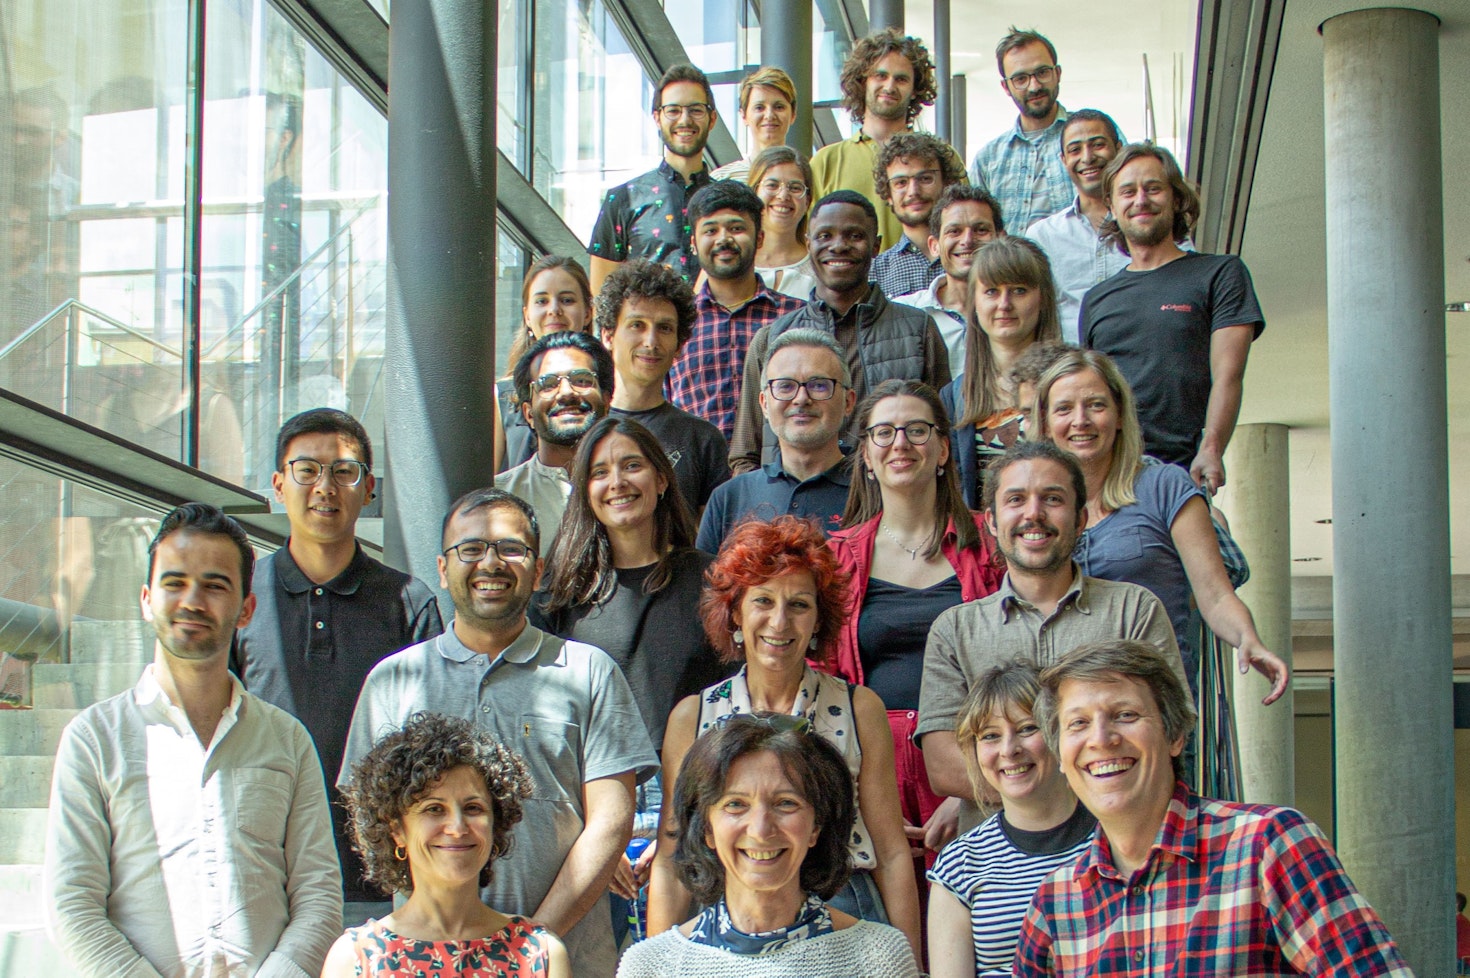
38
Persone
14 con dottorato di ricerca
54
Progetti in corso
25 con partner internazionali
25
Pubblicazioni in riviste scientifiche
55
Presentazioni in conferenze scientifiche
Data refer to the last issue of the Activity Report. See all Facts & Figures.
Research Groups
1 - 3
News & Events
1 - 4