
ScienceBlogs
agriculture
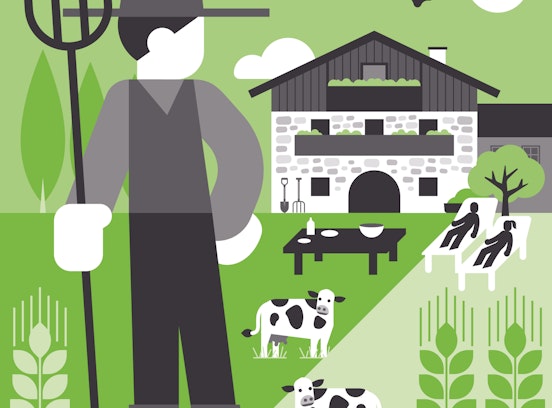
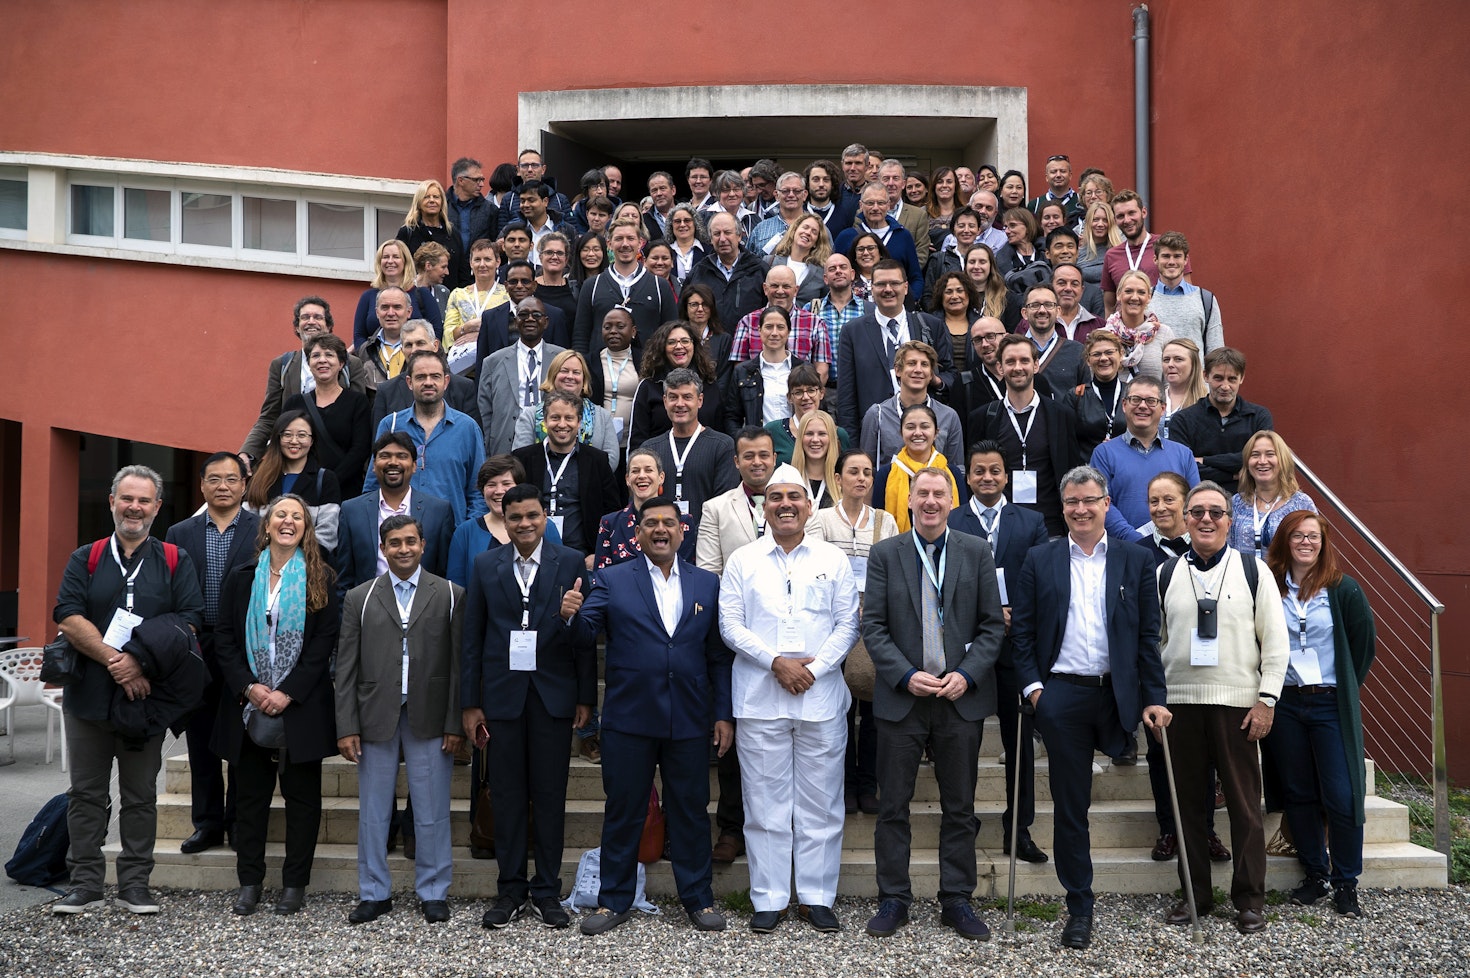
Agritourism Global Core Values
 Barbieri Carla
Institute for Regional Development
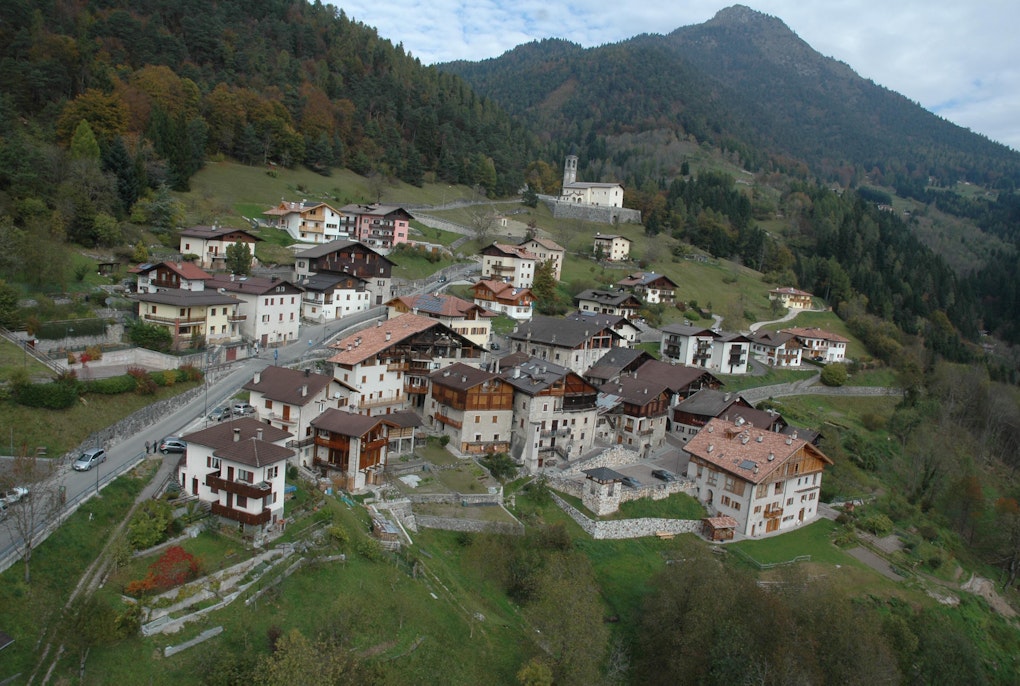
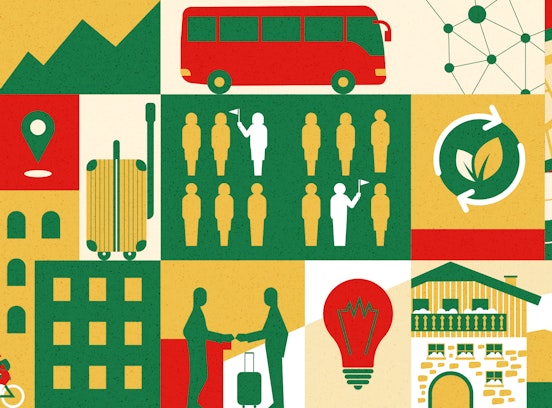
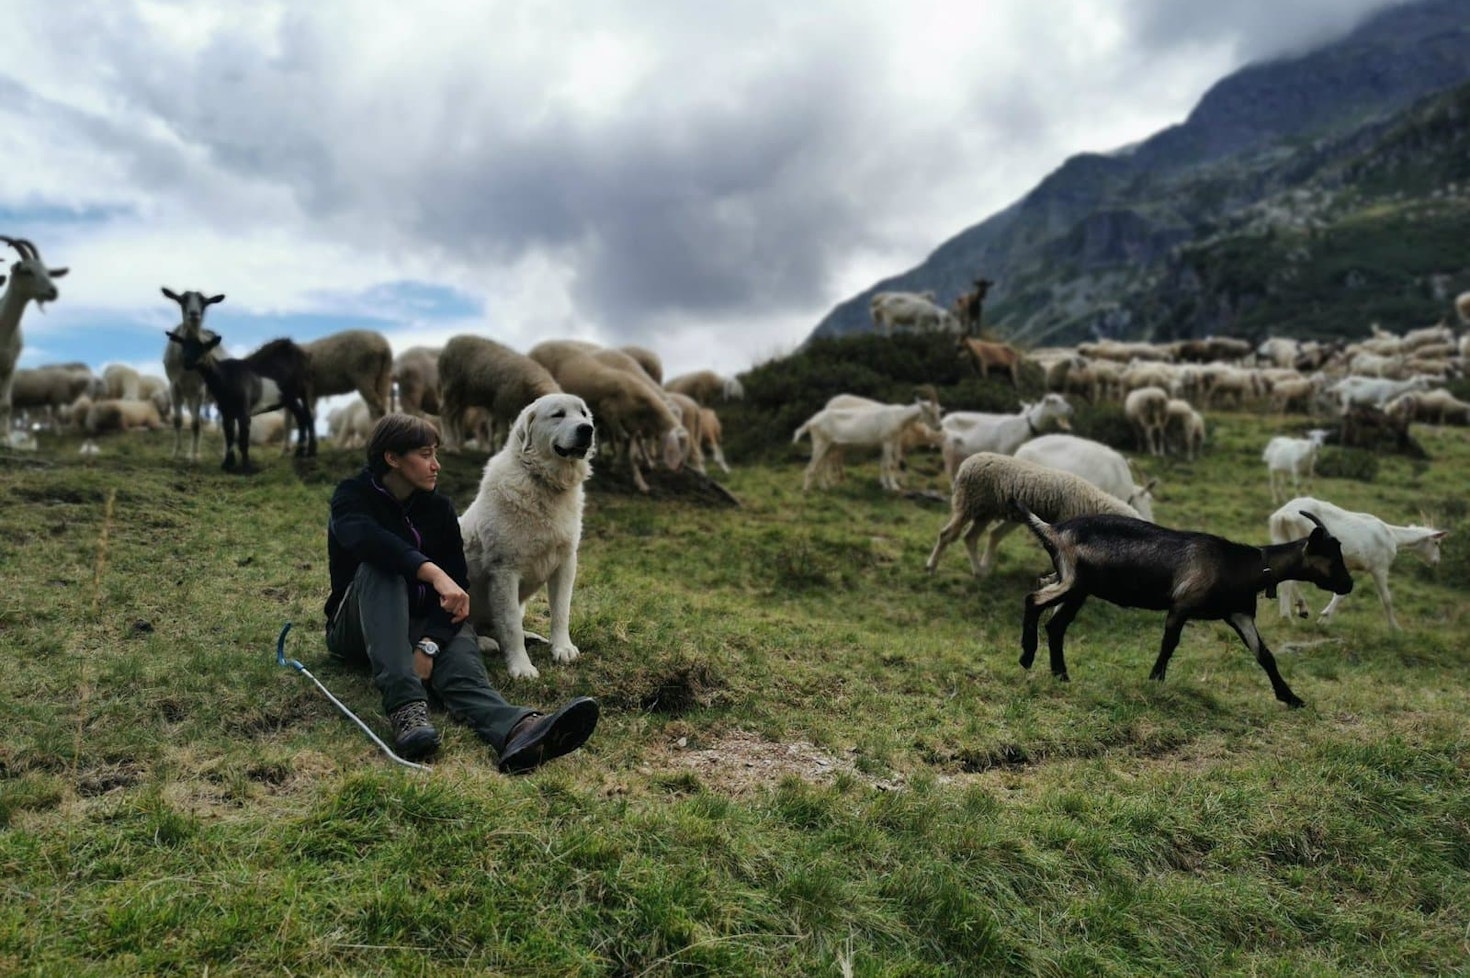
Promoting social justice, supportive and resilient communities and increasing environmentally friendly mindsets is the goal of our transformation research at our Institute. By fostering relationships with the people in South Tyrol's valleys and other mountain regions and endowing citizens with responsibilities as our co-researchers, local knowledge and science combine to shape the future in a sustainable way.
Data refer to the last issue of the Activity Report. See all Facts & Figures.
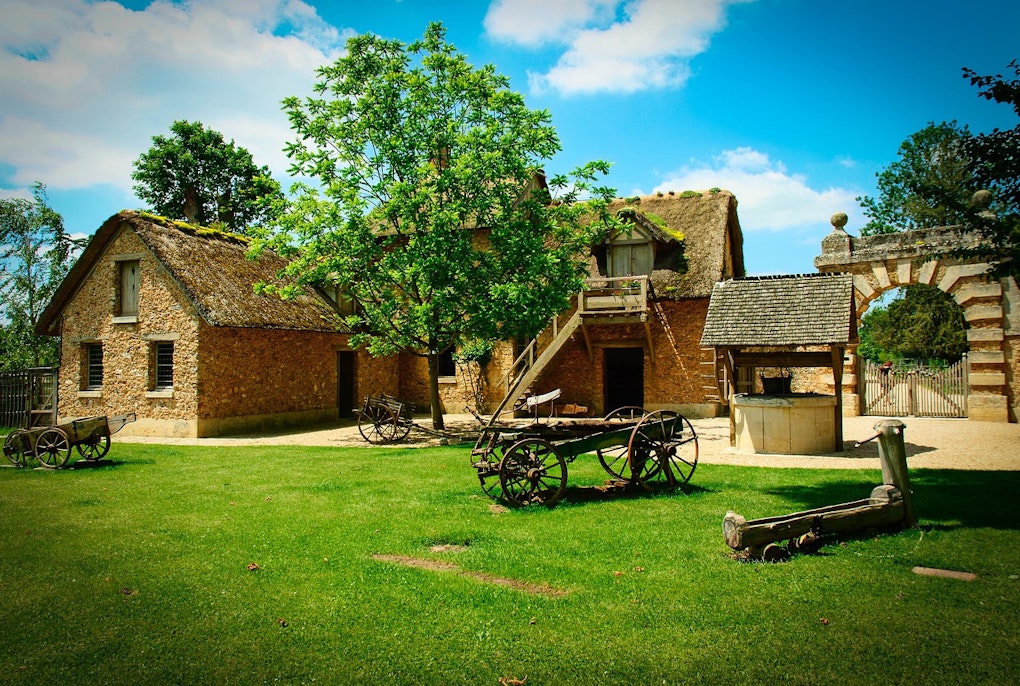
In rural areas there is still great potential to use material and immaterial resources sustainably. To this end, we are working with local people to develop ...
see more
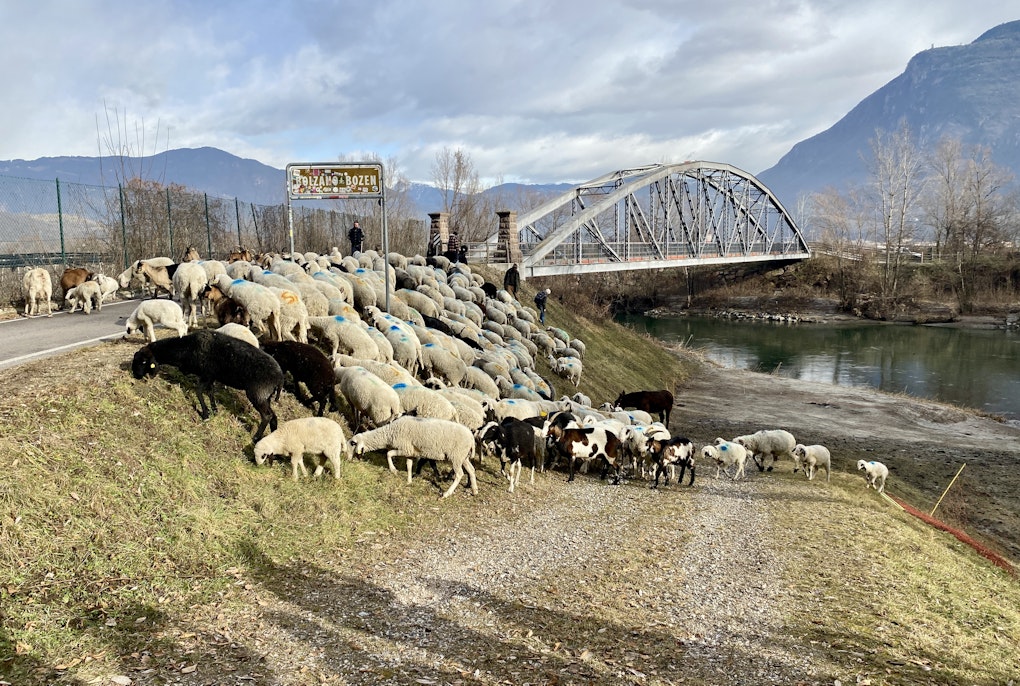
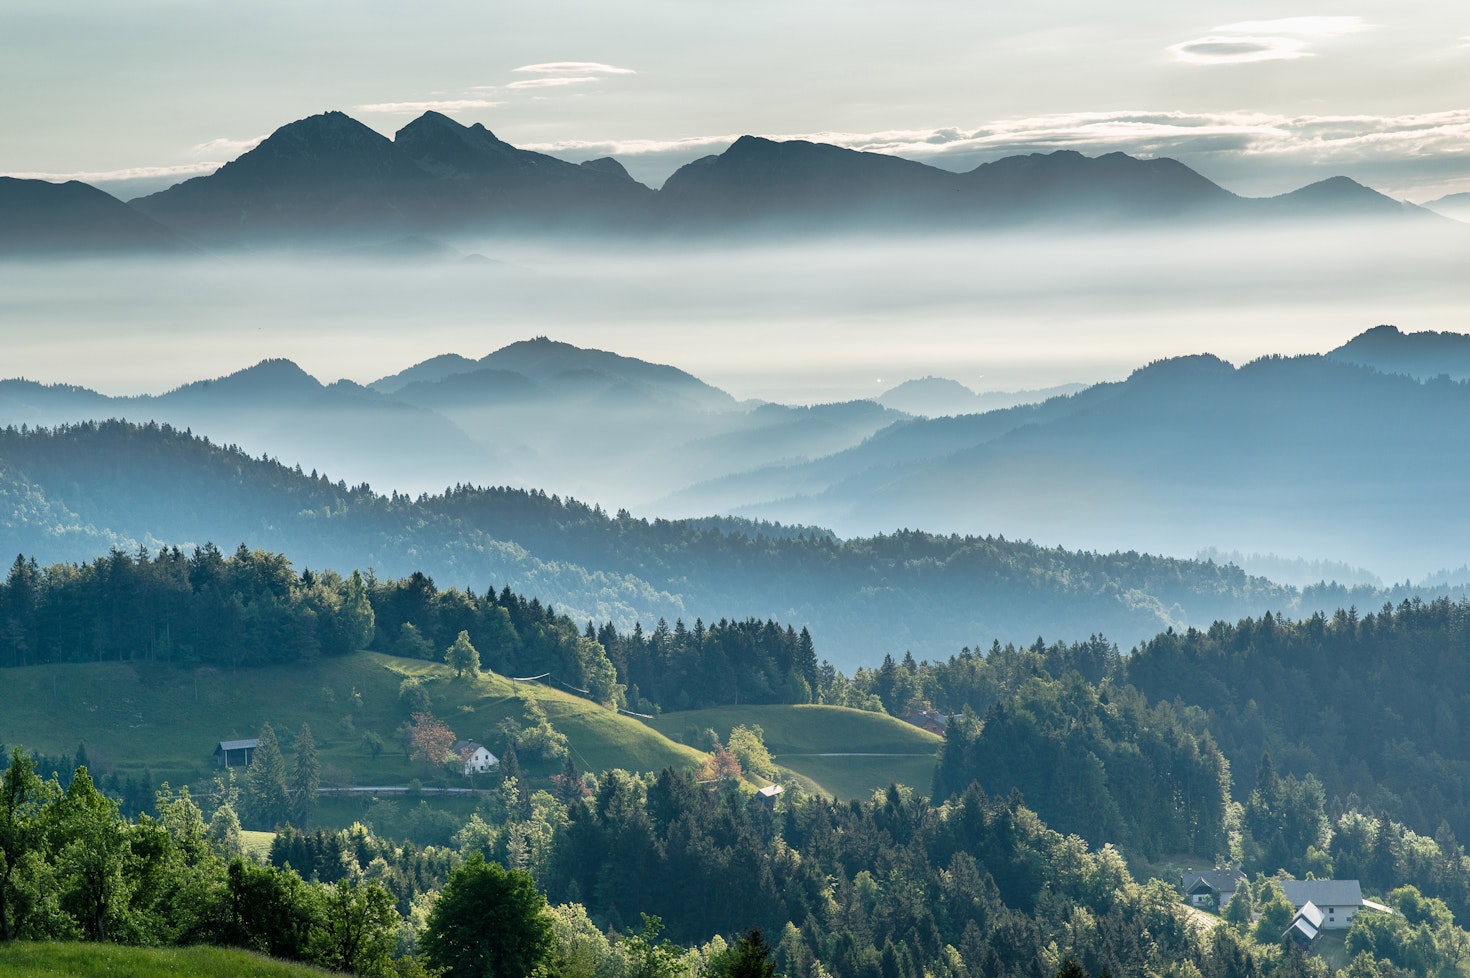
Human-environmental interactions can be defined as interactions between the human social system and the ecosystem. These interactions show how humans adapt to ...
see more
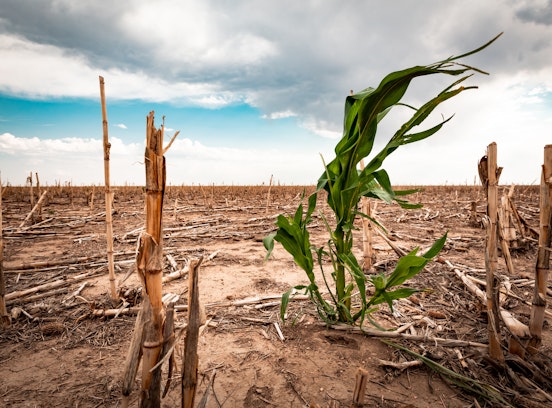
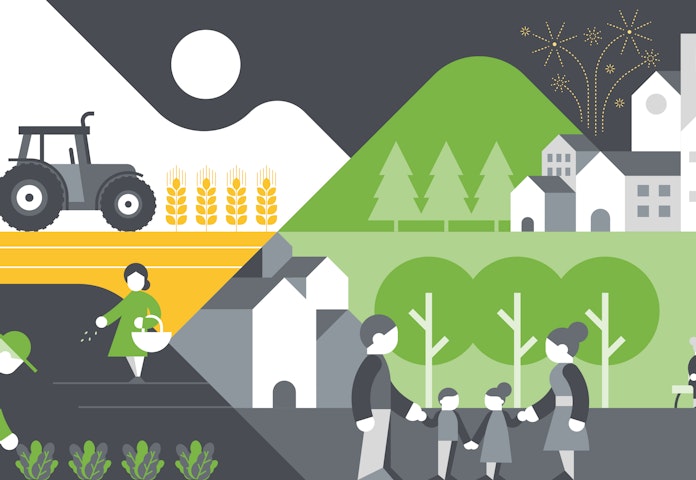
Our world is facing a series of unprecedented crises that relates to our economy, environment, climate and way of living. Our task is to accelerate the ...
see more