Cerealicoltura
 Ricarda Schmidt
The effects of demographic change in Europe – e.g. aging population, urban shrinking, rural deprivation, depopulation and urban-rural migration – are some of the biggest societal challenges facing European countries. Several strategic agendas and programs at the European (e.g. EU cohesion policy, Territorial Agenda, EU2020), national and regional levels address these consequences and encourage the search for appropriate solutions.
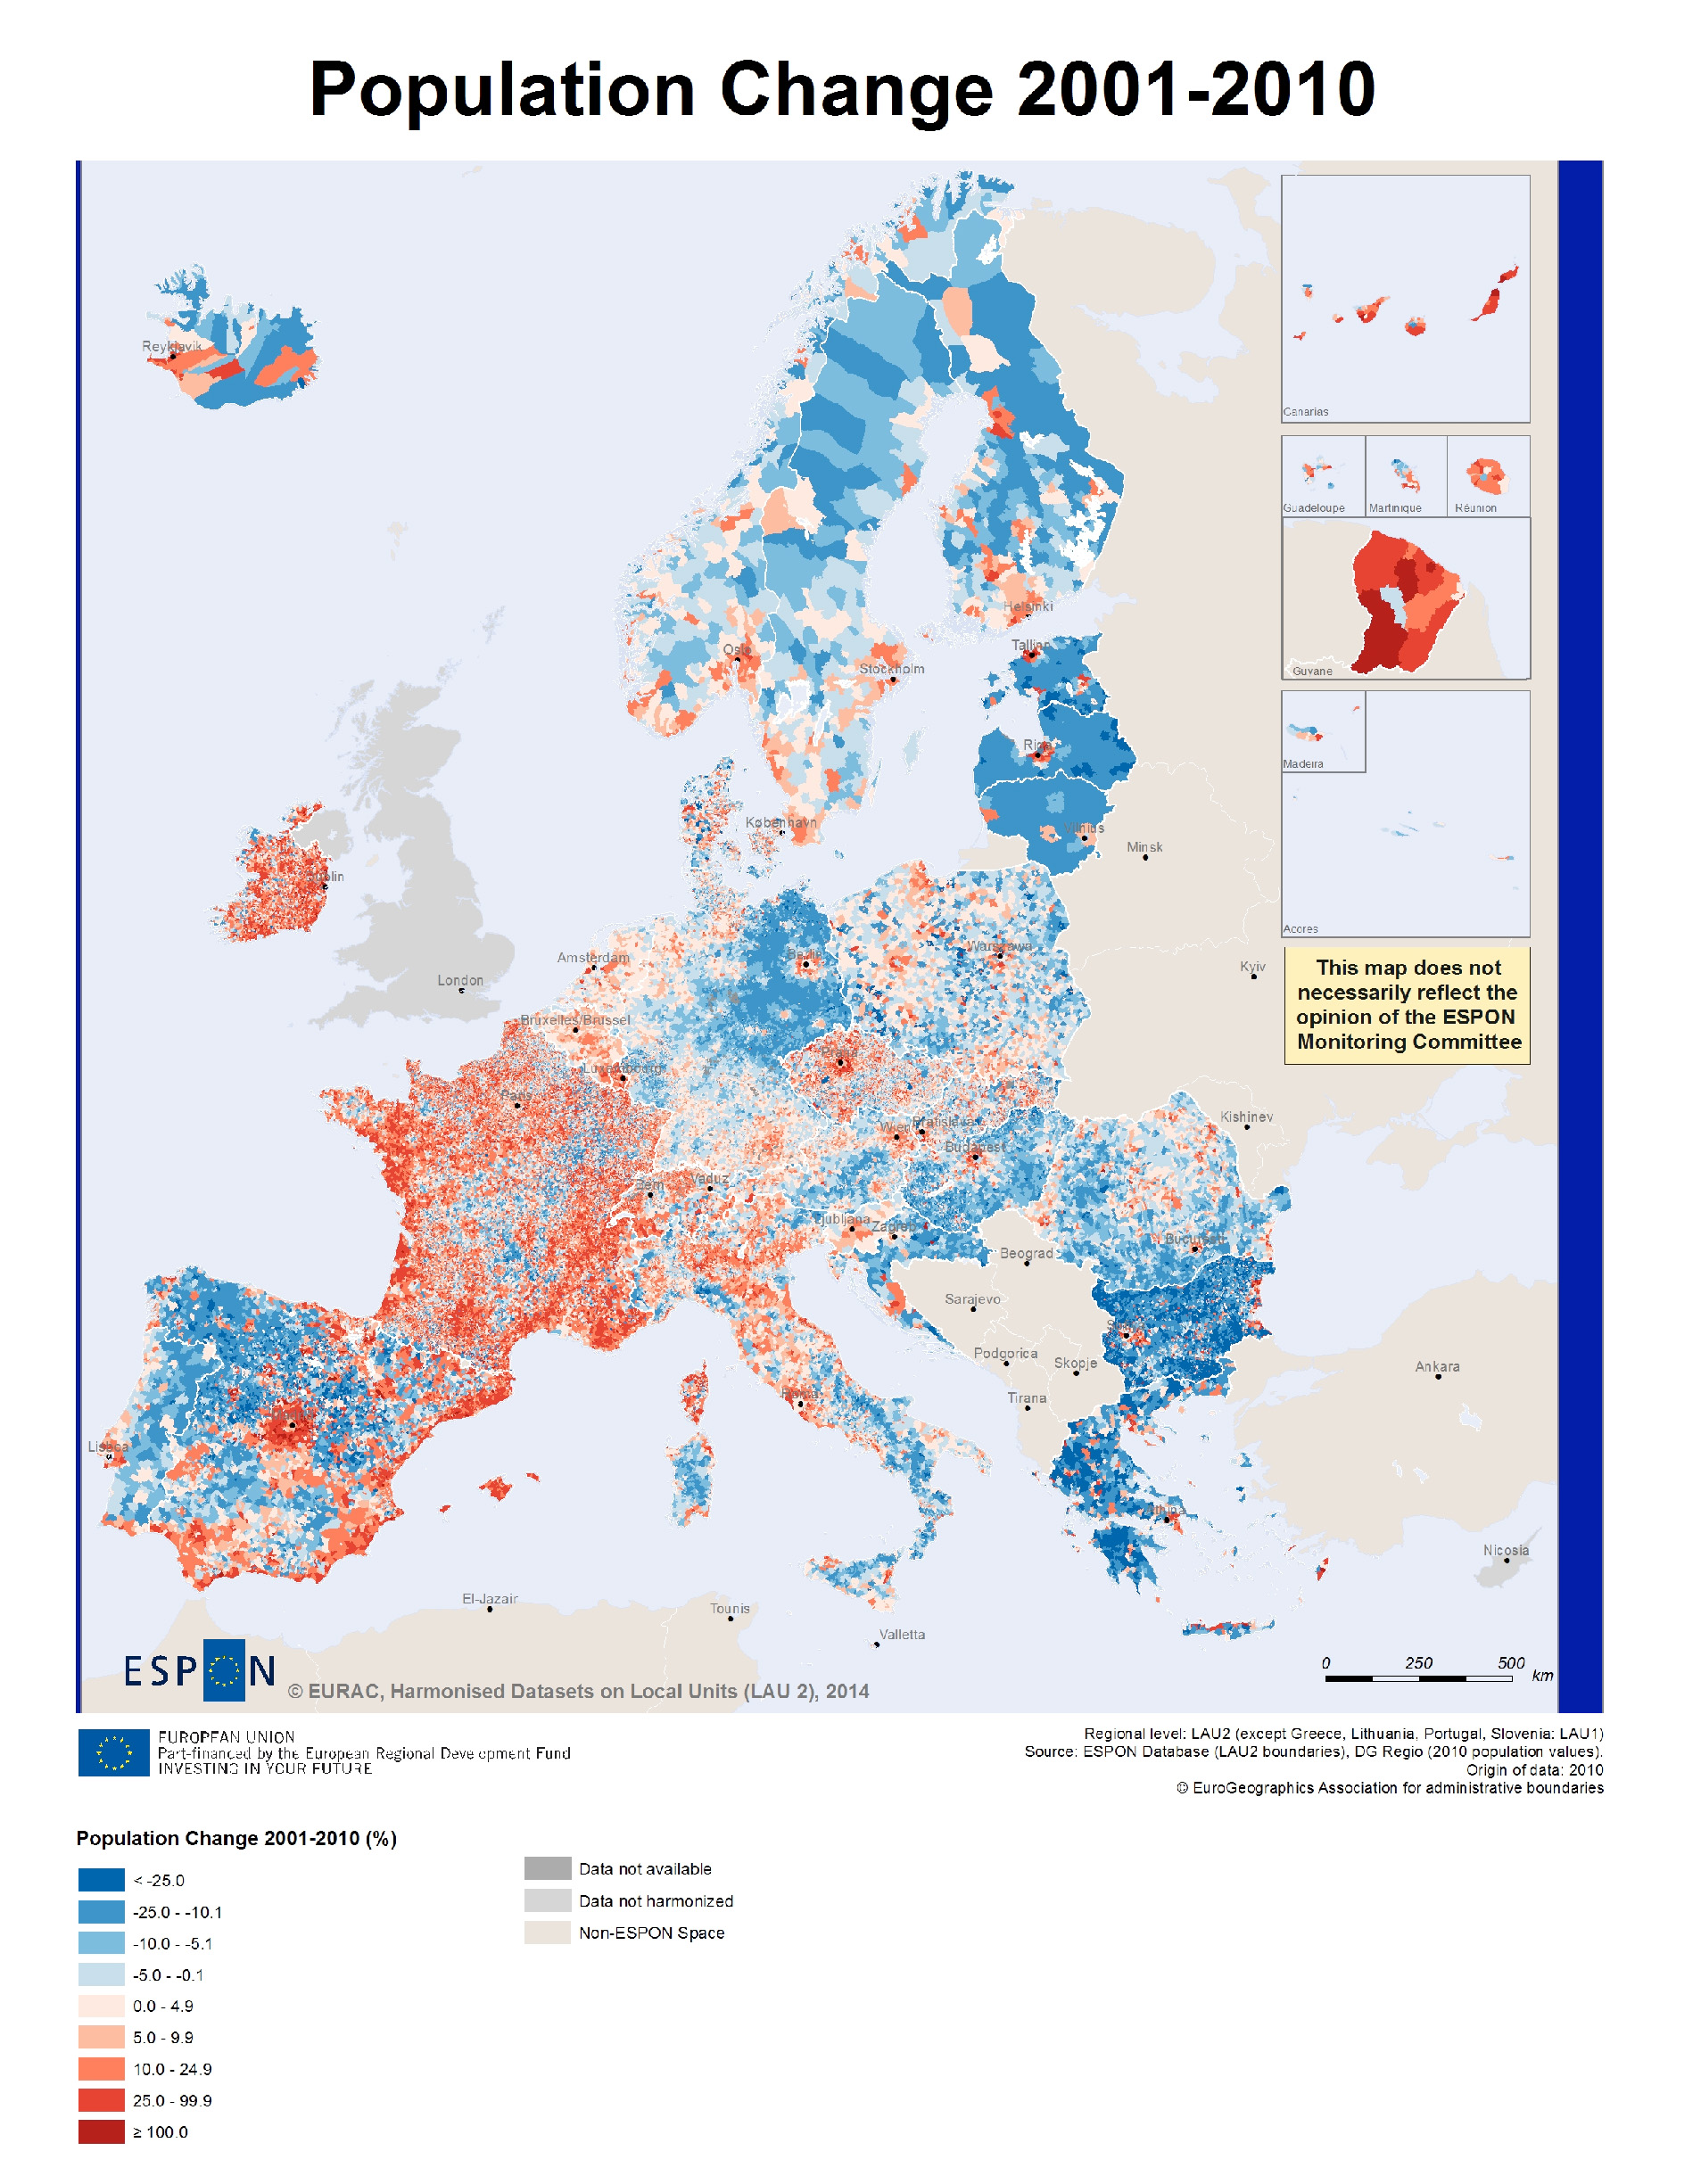
It is widely acknowledged that the consequences of demographic change strongly affect peripheral and rural areas. On the contrary, urban areas have to deal with a rising number of new inhabitants that place a good deal of pressure on the existing housing market, transport and service infrastructure, which have reached their carrying capacity limits. Analyzing demographic changes is useful, as it will make some of the aforementioned phenomena possibly visible, suggesting to policy-makers areas where interregional collaboration would be required. Recently, collaborators of the EURAC Institute for Regional Development elaborated a map on the demographic development for whole Europe. It depicts the changes of the population between 2000 and 2010 on municipality level, which represents the most detailed administrative level for statistical census data. The map is a result of the ESPON project “Update of Indicators and Maps (2011-2014) – Harmonised Datasets on Local Units (LAU 2)”. The mapping of the demographic dynamics of the last decade allows for analyzing population evolutions within the European countries and regions as well as among them.
Compared to other existing works, by using data at municipality level, explores the diversity of Europe’s territories and provides a complementary evidence between and within regions. The map shows that there are some interesting overall divergences between the countries. First, one can perceive a distinctive population growth in France, Switzerland and Ireland. This also holds true for some specific areas, in most cases represented by metropolitan regions like Madrid, Budapest, Sofia and Berlin and the urban region in the Baltic States or border areas, e.g. the northwest coast of France, the east coast in Spain or the pre-alpine Italian regions. They all stand out in sharp contrast to their surrounding areas. Certain countries show distinct heterogeneous regional contrasts and diversity, e.g. Italy, Finland, Germany, Hungary, Spain and Sweden, caused by the divergence between the growing urban areas and the predominantly rural areas. France, Ireland and Poland show a quite homogenous geographic development of demography. The distinguishing and eye-catching overall and countrywide population growth in France and Ireland are impressive. Normally, larger urban areas and urban surroundings register these high uniform growth rates. They contrast with countries with general low population growth or even losses like Greece, Bulgaria, Hungary and the Baltic States.

Against the background of generally very low national birth rates and often even negative natural population balances, in many cases, a positive migratory balance mainly drives population growth. The maps depict the contrasts and divergences between the growing urban and steadily declining backlogged rural areas. One can perceive it in nations like Spain, Italy, eastern Germany and most Eastern European countries. Nevertheless, how to interpret the situation in countries like France, Ireland, Poland, Netherlands and Belgium? In France, we see the outcomes of a family-friendly policy, which in conjunction with a geographical well distribution of basic public services like schools led to a general and evenly dispersed positive natural population growth. Ireland has one of the highest fertility rates in Europe. More complex is the situation in the other countries. The fertility rates in Belgium and Netherlands are above EU average, while in Poland they are below. Hence, a positive net migration has its impact, especially in Poland. As one may can see data at municipality, level allows visualizing dynamics in smaller Member States, thus increasing the ability to develop territorial indicators for smaller geographic units, as well as to reveal large heterogeneous and inter-municipal divergences. They are omitted by NUTS-regional cartographic representations. This improves the ability to draw conclusions on positive natural and net migration induced population change and as a consequence, on effects of policies and socioeconomic regional competitiveness and territorial cohesion. For its ability to support decision-making at the regional, provincial, national and the broader European level there is a growing recognition of the importance of collecting data and performing statistical analyses at municipal level (LAU2). This enables more targeted definitions and orientations in support of the cohesion policy. Furthermore, it enables the increase in knowledge about cities and rural regions across Europe. Although it is very much encouraged, obtaining (i.e. collecting and analyzing) data at LAU2 level is still extremely challenging due essentially to the difficulties related to collection, harmonization and comparability. Nevertheless, in the framework of several projects, the Institute for Regional Development has gained comprehensive experience in this field.
This is evidenced in recent works produced within the framework of the project Monitoring the Alpine Space /Monas and the V Report on the state of the Alps on demographic changes published by the Alpine Convention. They are relevant evidence-based information on spatial developments on a very detailed geographic level. Thereby, the stakeholders responsible for the EU regional development (DG Regio) as well as those who govern the EU strategy for the Alpine Macroregion (EUSALP) dispose of various precise facts to steer cohesion policies and measures appropriately.
Authors: Elisa Ravazzoli and Thomas Streifeneder
Useful links
This content is licensed under a Creative Commons Attribution 4.0 International license.